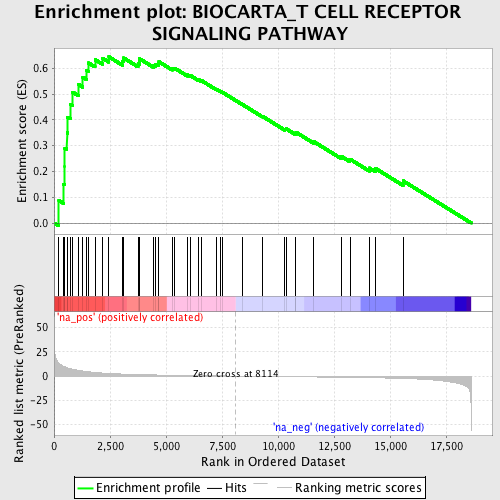
Profile of the Running ES Score & Positions of GeneSet Members on the Rank Ordered List
| Dataset | set04_transDMproB_versus_transDMpreB |
| Phenotype | NoPhenotypeAvailable |
| Upregulated in class | na_pos |
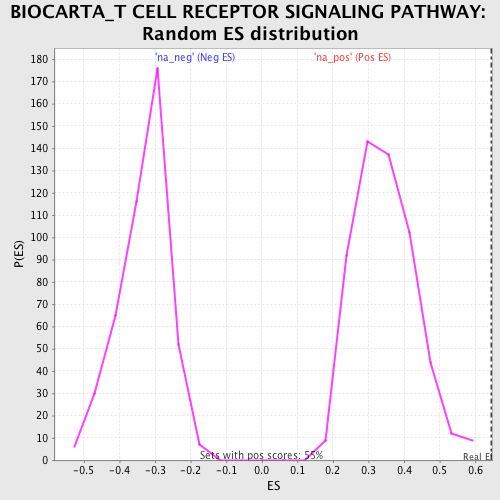
| GeneSet | BIOCARTA_T CELL RECEPTOR SIGNALING PATHWAY |
| Enrichment Score (ES) | 0.6446743 |
| Normalized Enrichment Score (NES) | 1.8669202 |
| Nominal p-value | 0.0 |
| FDR q-value | 0.08775402 |
| FWER p-Value | 0.219 |
| PROBE | GENE SYMBOL | GENE_TITLE | RANK IN GENE LIST | RANK METRIC SCORE | RUNNING ES | CORE ENRICHMENT | |
|---|---|---|---|---|---|---|---|
| 1 | NFATC1 | 213 | 13.199 | 0.0873 | Yes | ||
| 2 | LAT | 424 | 10.053 | 0.1513 | Yes | ||
| 3 | ARFGAP3 | 476 | 9.537 | 0.2200 | Yes | ||
| 4 | VAV1 | 479 | 9.504 | 0.2910 | Yes | ||
| 5 | FYN | 575 | 8.548 | 0.3499 | Yes | ||
| 6 | LCK | 599 | 8.357 | 0.4112 | Yes | ||
| 7 | ZAP70 | 729 | 7.525 | 0.4606 | Yes | ||
| 8 | RALBP1 | 832 | 7.008 | 0.5076 | Yes | ||
| 9 | NCF2 | 1099 | 5.824 | 0.5368 | Yes | ||
| 10 | PPP3CC | 1281 | 5.185 | 0.5659 | Yes | ||
| 11 | PTPN7 | 1454 | 4.695 | 0.5918 | Yes | ||
| 12 | PPP3CB | 1536 | 4.496 | 0.6211 | Yes | ||
| 13 | MAPK3 | 1828 | 3.801 | 0.6339 | Yes | ||
| 14 | ARHGAP4 | 2163 | 3.163 | 0.6396 | Yes | ||
| 15 | JUN | 2446 | 2.711 | 0.6447 | Yes | ||
| 16 | PPP3CA | 3049 | 2.097 | 0.6280 | No | ||
| 17 | ARHGAP1 | 3104 | 2.051 | 0.6404 | No | ||
| 18 | RAC1 | 3748 | 1.593 | 0.6177 | No | ||
| 19 | CAMK2B | 3804 | 1.553 | 0.6264 | No | ||
| 20 | ARHGAP6 | 3820 | 1.542 | 0.6371 | No | ||
| 21 | PIK3CA | 4439 | 1.215 | 0.6129 | No | ||
| 22 | PIK3R1 | 4537 | 1.166 | 0.6164 | No | ||
| 23 | RELA | 4669 | 1.113 | 0.6177 | No | ||
| 24 | GRB2 | 4679 | 1.109 | 0.6255 | No | ||
| 25 | CD247 | 5274 | 0.876 | 0.6001 | No | ||
| 26 | MAP3K1 | 5375 | 0.838 | 0.6010 | No | ||
| 27 | SHC1 | 5949 | 0.636 | 0.5749 | No | ||
| 28 | SOS1 | 6098 | 0.595 | 0.5714 | No | ||
| 29 | CD3G | 6444 | 0.488 | 0.5565 | No | ||
| 30 | CD3D | 6591 | 0.444 | 0.5519 | No | ||
| 31 | FOS | 7226 | 0.262 | 0.5198 | No | ||
| 32 | PRKCA | 7416 | 0.203 | 0.5111 | No | ||
| 33 | CD3E | 7530 | 0.167 | 0.5063 | No | ||
| 34 | MAP2K4 | 8407 | -0.083 | 0.4597 | No | ||
| 35 | CD4 | 9308 | -0.306 | 0.4135 | No | ||
| 36 | PTPRC | 10296 | -0.556 | 0.3646 | No | ||
| 37 | ARHGAP5 | 10358 | -0.571 | 0.3655 | No | ||
| 38 | TRB@ | 10784 | -0.670 | 0.3477 | No | ||
| 39 | RAF1 | 10793 | -0.671 | 0.3523 | No | ||
| 40 | PLCG1 | 11581 | -0.861 | 0.3163 | No | ||
| 41 | HRAS | 12835 | -1.210 | 0.2579 | No | ||
| 42 | ARFGAP1 | 13208 | -1.323 | 0.2478 | No | ||
| 43 | MAPK8 | 14071 | -1.628 | 0.2136 | No | ||
| 44 | MAP2K1 | 14347 | -1.742 | 0.2118 | No | ||
| 45 | NFKBIA | 15580 | -2.404 | 0.1635 | No |